From E-8 to E-823
 |
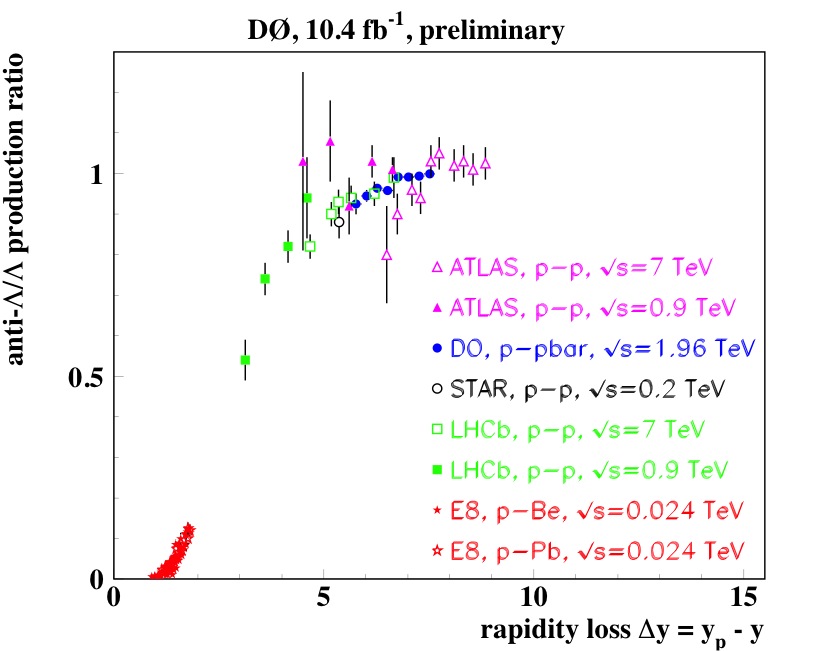
| Data from five very different experiments over a wide range of energies and taken over a span of four decades fall together on a smooth curve here. When the trajectory of the outgoing Λ or anti-Λ is close to the trajectory of the incoming proton (the left side of the plot), there are relatively few anti-Λ produced. On the right, when the outgoing trajectory is very different from the incoming one, Λ and anti-Λ are produced at the same rate. |
Disponible en español
Today's DZero result involves two orders of magnitude — in experiment number!
A proton contains three quarks: two u (up) flavored quarks and a d (down) flavored quark. (Avid readers will recall that we are speaking here of valence quarks.) If one of the u quarks is replaced with an s (strange) flavored quark, the resulting particle is a Λ (Lambda) rather than a proton. That replacement process can easily happen in collisions of protons with antiprotons, as was done in the Tevatron.
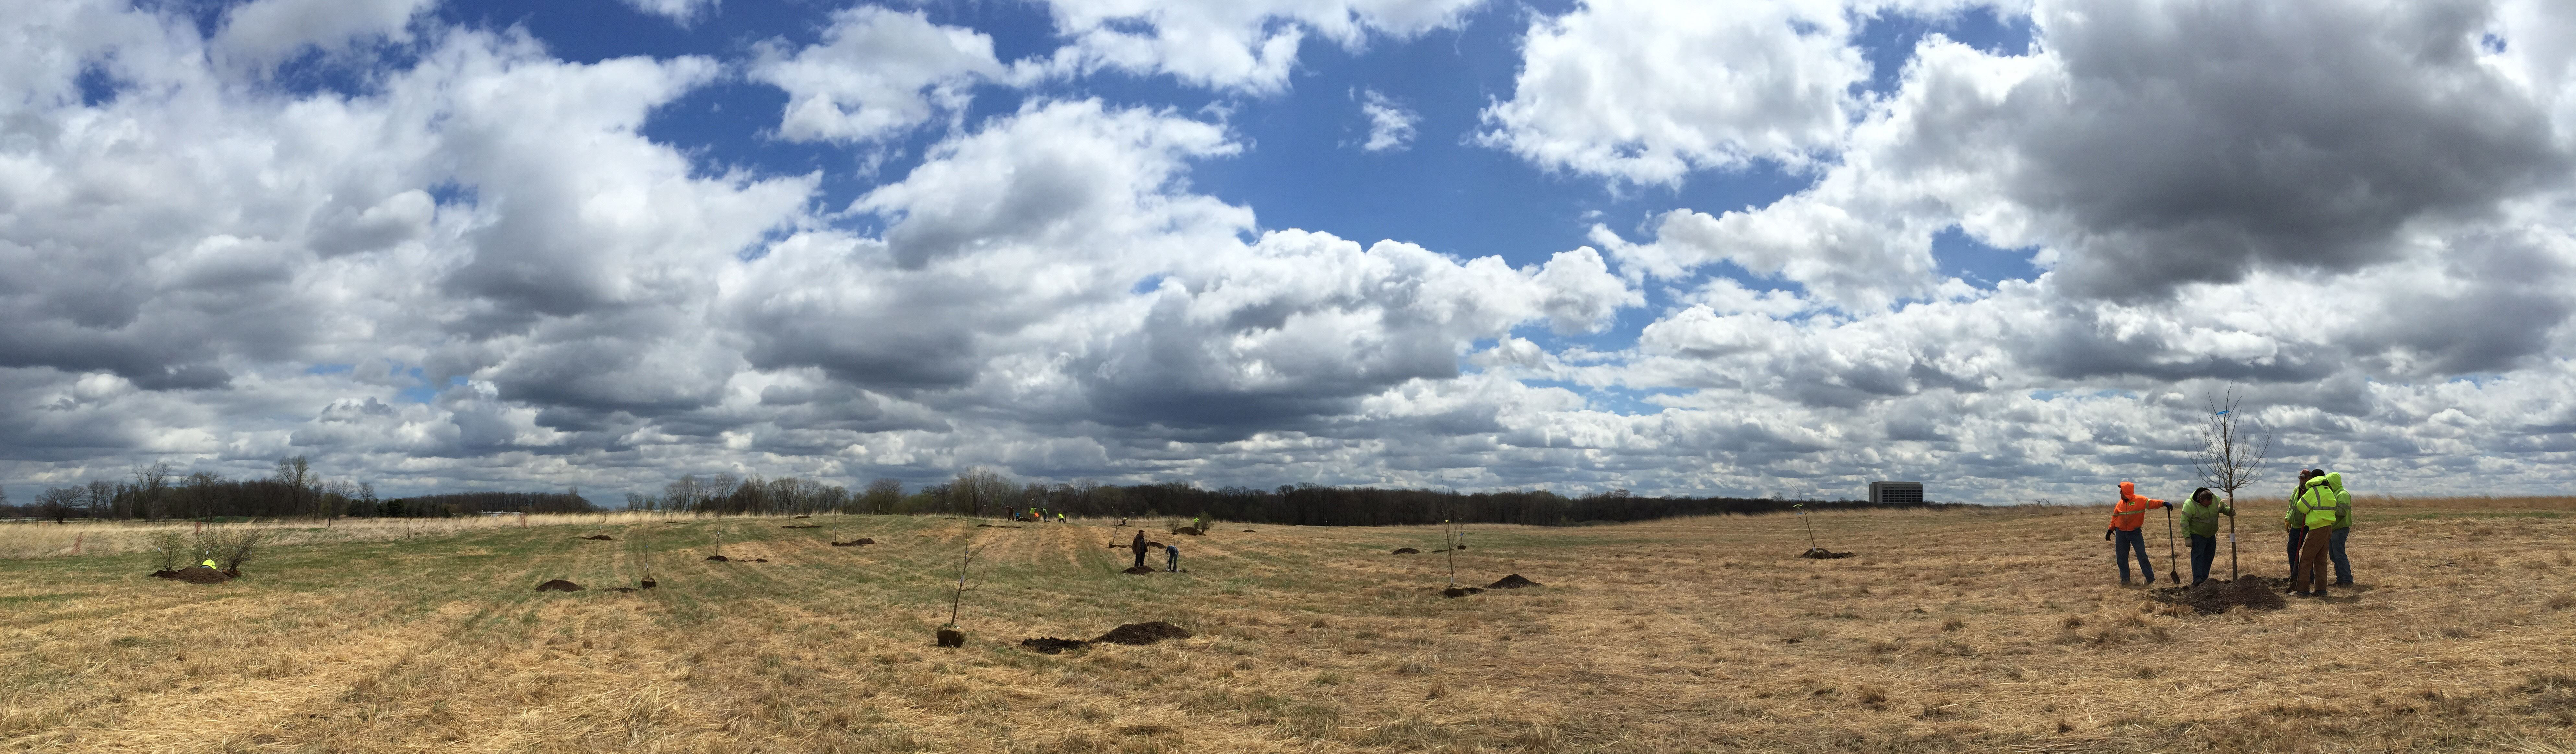
In the exchange process, there is a marked tendency for the two unchanged quarks — the ud diquark, as it is called — to continue after the interaction in nearly the same direction as they had as they entered the collision. At DZero, for example, protons entered the detector from the north side of the building, and the produced Λ particles headed south from the interaction region. Still, a few north-bound Λ particles were produced as well. The Λ that were produced in the expected direction are called "forward," and Λ that were produced in the opposite direction are called "backward." Anti-Λ were also produced, and they tended to go in the direction of the incoming antiproton.
DZero has recently measured the directions of Λ particles — the asymmetry between the forward and backward production rates at the Tevatron. The difference between the forward and backward rates is on the order of a few percent of the total production rates.
Next, we compared this result with results from other experiments. Take a look at the plot above. The horizontal axis of the plot is labeled "rapidity loss." The lower this number is, the more the outgoing Λ has the same trajectory as the incoming proton. The vertical axis is the rate at which anti-Λ are produced divided by the rate at which Λ are produced. On the right side of the plot, where the Λ direction is very different from the proton direction, both Λ and anti-Λ are produced at about the same rate. On the left hand side, where the outgoing Λ has a very similar trajectory as the incoming proton, there are few anti-Λ produced.
The plot shows a nice smooth S-shaped curve. That curve describes the results of five very different experiments. Three of them collide protons with other protons. One collides protons with antiprotons, and one collides protons with lead and beryllium nuclei. And the range of energies involved is large: The energies of the highest-energy collisions on this plot are roughly 300 times those in the lowest-energy collisions.
What is entertaining here is that we are able to compare the latest results from DZero, which is Fermilab Experiment 823, with those of Fermilab Experiment 8. E-8 was proposed in June 1970 and ran until March 1976. You may not have been born yet! But the laws of physics are still unchanged.
—Leo Bellantoni
 |
| Bruce Hoeneisen of Universidad San Francisco de Quito in Quito, Ecuador, is the primary analyst for this measurement. |
 |
| The DZero collaboration thanks the collaborators pictured here for their support with the computing needed for DZero analysis. Top, from left: Qizhong Li (Fermilab), Herb Greenlee (Fermilab), Peter Svoisky (Oklahoma). Bottom, from left: Peter Vokac (Czech Technical University, Prague, Czech Republic) and Jesus Orduna (Rice). |
|