|
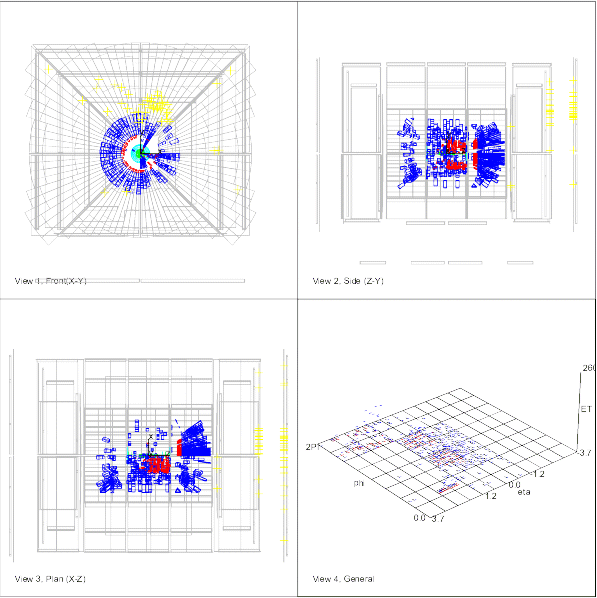
DZero sees collisions |
|
April 4, 2001  | |
April 3, 2001 | |
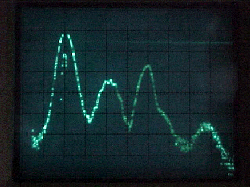
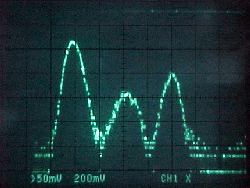
| Before cogging by 2 buckets | After cogging by 2 buckets |

|

|
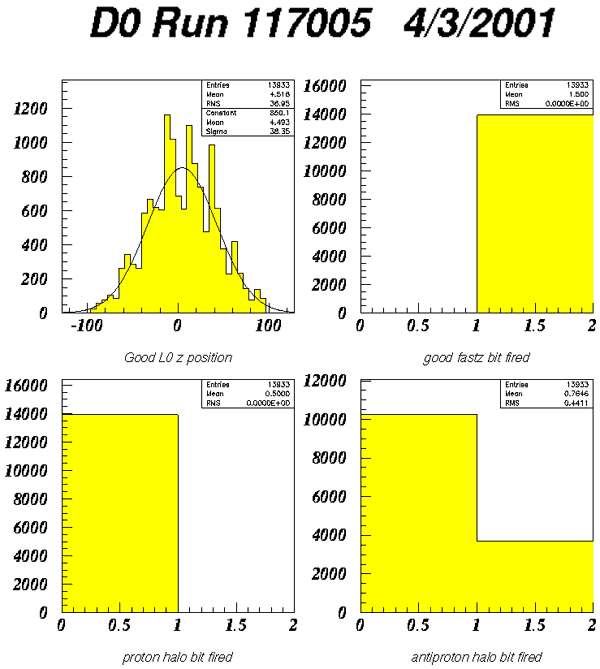
 The four plots you see are (from top left to right): 1. Interaction vertex distribution in the unit of cm from the center of the detector (0 is the middle of the detector) 2. A good quality event distribution from our minimum bias trigger 3. (left bottom) Proton halo information. The fact that it's all 0 means that the Beams Division did a good job squeezing the proton bunch so that we did not see extraneous beam halo from the proton 4. (right bottom) Anti-proton halo information. A minimal number of 1 means that the anti-proton bunches were dirtier than protons. | |
| last modified 4/4/2001 email Fermilab |
FRLsDFx9eyfrPXgV