 )
production from 0° to several milliradians at all energies
)
production from 0° to several milliradians at all energies
______________________
* Contact Person: longo@fnal.gov
The most poorly understood aspect of hadron physics at Collider energies is particle production and energy flow at very small angles. Essentially the only data now available are at fixed-target energies. The proposed measurement would extend this knowledge a factor of 50 in center-of-mass energy. The fact that we know so little about the processes which account for a large fraction of the total cross section is an embarrassment. Data from this region are vital to understanding the general features of very high energy hadron interactions, and, in particular, are required to understand the composition of ultra-high energy cosmic rays.
We propose a technique which would allow comprehensive measurements of hadron production at 0° for the first time at Collider energies. The proposed experiment in its basic configuration would measure:
Photon production from 0° to angles of several mrad at all energies. The p° and h° energy spectra can be inferred from the 2-photon events.
Neutral hadron (primarily )
production from 0° to several milliradians at all energies
 production from 0°
to angles of several mrad (using vees).
production from 0°
to angles of several mrad (using vees).
Total positive hadron production from 0°
to angles of several mrad in the  direction and
momenta from 1 TeV/c down to approx. 50 GeV/c.
direction and
momenta from 1 TeV/c down to approx. 50 GeV/c.
Total negative hadron production at 0° in
the  direction between =50 and 900 GeV/c and at
angles of several mrad from =1 TeV down to =50 GeV/c.
direction between =50 and 900 GeV/c and at
angles of several mrad from =1 TeV down to =50 GeV/c.
Separation of electrons and muons from hadrons should also be possible.
With a two detector configuration we can study the production of 2e, 2m, and 2g states at near 0° angles.
This program would take several days of dedicated
running with collisions taking place at several locations in or near the
cold dipole magnets close to a long straight section. A proper choice of
the location of the interaction point allows a 0° neutral beam to come
off at an angle of approx. 5 mrad from the circulating beams in the straight
section. The detectors would be placed near the opposite end of the straight
section. This requires only a "thin" window approx. perpendicular to the
secondary beam and a reasonably clear line to the detector. Charged particle
production at and near 0° can be studied with different locations of
the interaction point.
A. Physics Objectives
Perhaps the most poorly understood aspect of
hadron physics at Collider energies is particle production at very small
angles. Most of the energy and most of the produced particles go into this
region, yet it is terra incognito as far as experimental measurements
are concerned. Data from this region are vital to understanding the general
features of very high energy interactions. The data for inclusive production
in the forward region at fixed target energies are summarized by Voyvodic.1
The only data that exist at Collider energies are
from UA7 at the CERN p - collider2;
this experiment used small calorimeters mounted on Roman pots to measure
photons at angles >1.6 mrad.
collider2;
this experiment used small calorimeters mounted on Roman pots to measure
photons at angles >1.6 mrad.
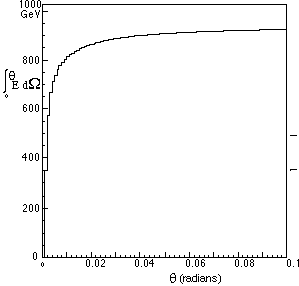
In Figure 1 we show the visible energy integrated
over angle as averaged over 6000 PYTHIA minimum bias events with  = 2 TeV. On average, about 90% of the energy is within 14 mrad of the beams.
CDF, for example, measures hadronic energy down to about 25 mrad (2°).
Very little data below 10° have emerged from collider detectors above
ISR energies. The proposed experiment would measure all the way down to
0° for both charged and neutral particles.
= 2 TeV. On average, about 90% of the energy is within 14 mrad of the beams.
CDF, for example, measures hadronic energy down to about 25 mrad (2°).
Very little data below 10° have emerged from collider detectors above
ISR energies. The proposed experiment would measure all the way down to
0° for both charged and neutral particles.
As discussed below, using several detector configurations
and interaction point locations we can map out the energy flow in the forward
direction for both neutral and charged particles. This will allow the mean
inelasticity from  = 2 TeV p -
 interactions to be determined for the first time.3
|
Fig. 1--Integrated visible energy vs. angle for PYTHIA minimum bias events. About 90% of the energy is contained within 14 mrad of the beams. |
 |
 = 10-40 GeV. For the highest energy cosmic rays that will be studied in
the Auger project, for example, this requires extrapolating four orders-of-magnitude
from existing data to
= 10-40 GeV. For the highest energy cosmic rays that will be studied in
the Auger project, for example, this requires extrapolating four orders-of-magnitude
from existing data to  = 400 TeV. The Tevatron
energy of 2 TeV c.m. is equivalent to about 2 PeV (2 x
1015 eV) for a cosmic ray proton incident
on a stationary nucleon, so the proposed measurement will give comprehensive
data at
= 400 TeV. The Tevatron
energy of 2 TeV c.m. is equivalent to about 2 PeV (2 x
1015 eV) for a cosmic ray proton incident
on a stationary nucleon, so the proposed measurement will give comprehensive
data at  =2 TeV, or up to the "knee" in the cosmic
ray spectrum.4
=2 TeV, or up to the "knee" in the cosmic
ray spectrum.4
Since so little is known about forward production at very high energies, it is hard to predict the potential of this experiment for new physics. Basically we are exploring new territory. Quark matter or gluon matter may manifest itself in the very forward direction, as suggested by cosmic ray data discussed below. With the first measurement of the spectrum of leading particles at collider energies, as well as the production of 2e, 2m, and 2g states at near 0° angles, some surprises may well appear. Indeed it would be surprising if no surprises appeared!5
High energy cosmic ray data, which are completely
dominated by very forward production, suggest that new phenomena appear
at Collider energies. Halzen6 makes the point that
all of these anomalies are associated with very high energy and near 0°
angles. As discussed below, this experiment would address at least two
of these anomalies directly, and probably settle the question of whether
they appear in  = 2 TeV p -
 interactions once and for all.
One common feature in cosmic ray interactions
at energies of 1 PeV and above is the existence of "halos" or miniclusters.
These appear as spots of very high optical density on the X-ray films.
The halos have fairly conventional pT's for jets,
of order a few GeV/c; however, the electromagnetic shower development within
the halo is anomalous.6 The average pT
inside the minicluster appears to be of order 20 MeV, rather than the usual
300 MeV (Ref. 7). This suggests some new phenomenon is taking place in
the very forward direction at cm energies >1 TeV. In a detector arrangement
such as that in Fig. 2 below, these miniclusters would appear in the electromagnetic
calorimeter as a dense concentration of electromagnetic showers with typical
separations ~13 cm, if the components have typical energies of 10 GeV.
These would be hard to miss if the miniclusters are indeed produced in
p - interactions with cross sections inferred
from the cosmic ray data.
interactions with cross sections inferred
from the cosmic ray data.
The well-known Centauro events6,7,8
are a class of very high energy cosmic ray events in which 30-50 hadrons
carry off a visible energy ~200 TeV. There are few, if any, g's.
The estimated total energies at the original interaction are ~1000 TeV
(equivalent to  = 1.4 TeV), and the number of hadrons
produced there is estimated to be 60-90. The production cross section is
~0.5 mb. Anti-Centauro events with many g's
and few charged particles have also been observed.9
Searches for Centauros at collider energies have been made by MiniMax10
at angles >20 mrad (h<4.6)
and by CDF11 at angles >30 mrad (h<4.2),
so that the rather prolific production of Centauros suggested by the cosmic
ray experiments does not occur in p -
= 1.4 TeV), and the number of hadrons
produced there is estimated to be 60-90. The production cross section is
~0.5 mb. Anti-Centauro events with many g's
and few charged particles have also been observed.9
Searches for Centauros at collider energies have been made by MiniMax10
at angles >20 mrad (h<4.6)
and by CDF11 at angles >30 mrad (h<4.2),
so that the rather prolific production of Centauros suggested by the cosmic
ray experiments does not occur in p - interactions
at comparable cms energies, at least for angles greater than ~20 mrad.
The proposed measurement would cover all the way down to 0°, corresponding
to a rapidity =9 for pions.
interactions
at comparable cms energies, at least for angles greater than ~20 mrad.
The proposed measurement would cover all the way down to 0°, corresponding
to a rapidity =9 for pions.
A rich trove of diffractive physics at  = 2 TeV can also be tapped. The FELIX LOI12 makes
a strong case for the QCD physics to be studied through production processes
at extreme rapidities (forward angles). Much of this physics is accessible
in the proposed experiment at a somewhat lower energy and with restricted
angular coverage. Still, the measurements will be unique, in that no comparable
measurements exist within 1.5 orders of magnitude
center-of-mass energy.
= 2 TeV can also be tapped. The FELIX LOI12 makes
a strong case for the QCD physics to be studied through production processes
at extreme rapidities (forward angles). Much of this physics is accessible
in the proposed experiment at a somewhat lower energy and with restricted
angular coverage. Still, the measurements will be unique, in that no comparable
measurements exist within 1.5 orders of magnitude
center-of-mass energy.
In addition, we would measure the cross section for
the production of muon and electron pairs near 0° for the first time
at Collider energies.  and K0
production can be measured using vees and the energies and angles in the
calorimeter.
and K0
production can be measured using vees and the energies and angles in the
calorimeter.
B. Basic Experimental Arrangement
The measurement of 0° production at the Collider
is made feasible by tuning the Collider so that collisions take place in
or near the cold dipole magnets close to a long straight section. If the
interaction point (IP) is chosen properly, a 0° neutral beam
emerges from the straight section at an angle =5 mrad from the circulating
beams in the straight section. The detector can then be placed conveniently
near the opposite end of the straight section, as illustrated in Fig. 2.
Note that transverse dimensions are exaggerated by a factor of 40 in the
figure. The  's are incident from the right. The
interactions occur in the cold bending magnet on the right side of the
figure. Negative particles with momenta ~360-500 GeV at 0° can be studied
simultaneously with neutrals using a second detector on the other side
of the straight section as in Fig. 3 (b). Charged particle production near
0° at lower momenta can be studied by moving the IP closer to the straight
section as discussed below.
's are incident from the right. The
interactions occur in the cold bending magnet on the right side of the
figure. Negative particles with momenta ~360-500 GeV at 0° can be studied
simultaneously with neutrals using a second detector on the other side
of the straight section as in Fig. 3 (b). Charged particle production near
0° at lower momenta can be studied by moving the IP closer to the straight
section as discussed below.
The detector is expected to be a calorimeter with an electromagnetic section in front and good shower location capability. A representative design is described in Appendix II. The detector is preceded by tracking chambers to allow charged particle trajectories to be extrapolated back to the IP.
Note that the figure shows the detector at C0 with the present Tevatron abort system and the Main Ring magnets removed as anticipated in the Main Injector era. The proposed Collision Hall for C0 is indicated. The Lambertson magnets now at C0 are assumed to be removed. The cold magnets are left unchanged at their present positions. The two warm C magnets now there are moved closer to the first cold quadrupole Q1. The vacuum pipe through the C-magnets is assumed to be enlarged to fill the available aperture. The equivalent of an additional half dipole can be added on the other side of the straight section to compensate for the removal of the Lambertsons. Many of these changes in the lattice will be necessary to accommodate the BTeV detector planned for the C0 area. Our needs are fairly flexible, and we will strive to work out an arrangement that is consistent with future plans for the area.
Because of the unconventional IP location, this measurement requires dedicated Collider time. However, since the cross sections to be measured are large and the required statistical accuracy is not great, a total running time of only a few days is needed. Likewise the luminosity requirements are modest.
The trigger counters on either side of the warm C-magnets can be used to reduce triggers from beam-gas interactions as necessary. Counters can also be placed between magnets on the other side of the interaction point as indicators of activity in the proton hemisphere. The "luminosity monitor" (Fig. 2) consists of tracking chambers and counters; it need only subtend sufficient solid angle to accept a large fraction of the total inelastic cross
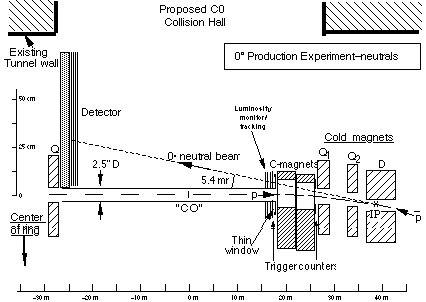
Figure 2 - Basic detector configuration
for 0° neutral measurement. Note that the transverse dimensions are
exaggerated by a factor of 40. The interaction point(IP) is about 38 m
from the center of the straight section. The existing C-magnets are moved
closer to the first cold quadrupole Q1.
The cold quadrupoles and dipoles are unchanged from their present positions.
section, so that the measured cross sections can be readily normalized. This requires a straightforward Monte Carlo estimate of the fraction of interactions seen by the luminosity monitor for each configuration and modest pointing capability to reject beam-gas interactions sufficiently. The luminosity monitor can be backed up by photon detectors. Tracking in the luminosity monitor also helps locate the position of the interaction. From the luminosity monitor tracking information and, in the case of charged particles, the information from the tracking chambers preceding the calorimeter, the point of origin of the particles can be determined with sufficient accuracy to reject beam-gas interactions. With this information and the calorimeter energies, the production angles and transverse momenta can be determined to reasonable accuracy.
Figures 3(a) and 3(b) show configurations appropriate for positive and negative particle production at 0° respectively. The IP is somewhat closer to the straight section for the positive particle measurements. The IP can be moved closer still to study lower momenta without moving the detector(s). Negative particles at 0° with momenta up to
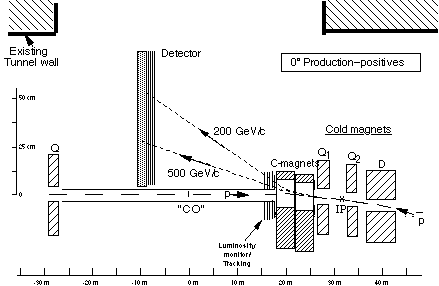
Figure 3(a) - Possible arrangement
for 200 to 500 GeV/c positive production at 0°. The nominal interaction
point is 32 m from the center of the straight section. Lower momenta can
be studied with the IP moved farther to the left.
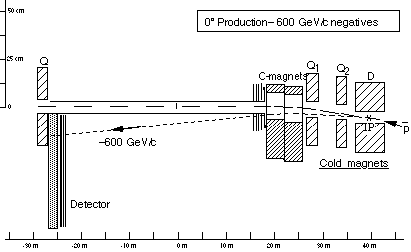
Figure 3(b)- Possible arrangement for approx. 600 GeV/c negative production at 0°. The nominal interaction point is at 40.5 m from the center of the straight section. Up to 900 GeV/c negatives at 0° can be measured with the IP at 52 m.
approx. 900 GeV/c can be studied with a detector
on the inside of the ring, as in Fig. 3(b). Since it is anticipated that
there will be two detectors, one outside and one inside the ring as discussed
below, the positive and negative production measurements can be made with
one detector setup with varying IP locations.
C. Two-detector Configuration
With a two detector configuration we can study
the production of 2e, 2m
and 2g states
at near 0° angles. The calorimeters could be followed by muon detectors,
for example, the muon detectors now in use in E871. Thus the forward production
of muon and electron pairs can be measured for the
first time.
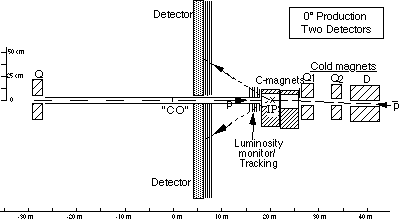
Figure 4 - Proposed configuration of two detectors for 2-particle final states. Note that the transverse scale is exaggerated by a factor of 20 in this case. The symmetric decay of a 160 GeV/c y produced at 0° (or an ° with 480 GeV/c) is illustrated.
D. Acceptance
The momentum range accepted and the pT range varies with the IP position. Table I gives approximate ranges for representative IP locations. The momentum range and rapidity range corresponding to pT = 0 are given for each charge, and the range of pT is given for a typical momentum. For IP locations <32 m, the momentum is limited on the high end by the ray which just clears the 1.25" inner radius of the "thin window"; the momentum is limited on the low side by the rays which just clear the aperture of the C-magnet. Only the horizontal apertures are considered in the table. A negative pT means that the pT kick is opposite the magnetic bending in the C-magnets. Note that for an IP location <50 m it is possible to look at elastic scattering with pT > 1.1 GeV/c; thus elastic scattering could be measured given sufficient running time. Most IP locations give significant acceptance for both neutrals and charged particles simultaneously, though at different momenta or pT.
Figure 5 shows the distribution in f vs. rapidity from a PYTHIA/GEANT simulation for positive pions in the outside detector in Fig. 4 with the IP at 20 m. All positive pions coming directly from the IP with E > 5 GeV are plotted. The vertical acceptance at lower rapidities is limited by the ±15 mm aperture of the C-magnet at 18 m. Possibilities for increasing this aperture are being investigated.
Figure 5 - f vs. rapidity and pT vs. pz from a PYTHIA/GEANT simulation for positive pions in the outside detector in Fig. 4 with the IP at 20 m. All positive pions coming directly from the IP with E > 5 GeV are plotted.
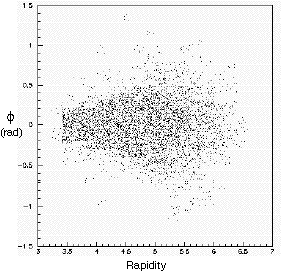
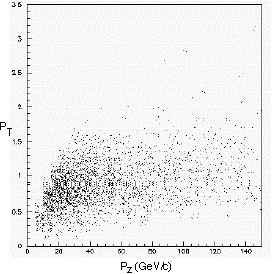
Table I--Ranges of momentum and rapidity(for pions except where indicated) accepted at pT = 0, and pT range for a typical momentum for various Interaction Point locations. A negative pT means that the pT kick is opposite the magnetic bending in the C-magnets. See text for more explanation.
|
|
|
|
|
|
|
|
| 20 m |
|
Neutral
Positive Negative |
|
|
1.2 to
0 to 0 to |
|
| 25 m |
|
Neutral
Positive Negative |
|
|
0.75 to
0 to 0 to |
|
| 30 m |
|
Neutral
Positive Negative |
|
|
0.4 to
0 to 0 to |
|
| 38 m |
|
Neutral
Positive Negative |
|
 ) ) |
0 to
-1.6 to 0 to |
|
| 50 m |
|
Neutral
Positive Negative |
|
|
1.1 to |
|
E. Discussion
Without particle identification the measurements
will be of combined hadron species of appropriate charge. Generally these
spectra will be dominated by one or two species. For example, in the neutral
beam setup the detected particles will be mostly g's
and antineutrons (assuming the detector is in the forward  hemisphere). These can be distinguished if the calorimeter is sufficiently
segmented in depth.
hemisphere). These can be distinguished if the calorimeter is sufficiently
segmented in depth.
Because it is the richest and most complicated,
we will discuss the 0° neutral setup (Fig. 2) in some detail. The detector
will see the entire energy spectrum for g's,
neutrons, antineutrons, and K°'s, as well as charged particles
from decays in flight. If the detector is in the forward  hemisphere, the antineutrons are expected to dominate. To compare the expected
yields of antineutrons and K°'s we use a simple PYTHIA13
simulation. For this purpose 12700 PYTHIA minimum bias events comprising
74.2 mb of the
hemisphere, the antineutrons are expected to dominate. To compare the expected
yields of antineutrons and K°'s we use a simple PYTHIA13
simulation. For this purpose 12700 PYTHIA minimum bias events comprising
74.2 mb of the  -p cross section at
  = 2 TeV were generated. In Fig. 6 we compare the distributions of antineutrons
and K°'s with E>10 GeV at a detector placed
60 m away from the IP. Note that except in the wings of the distribution
the antineutrons dominate. It may be possible to make a statistical separation
of antineutrons and K°'s on the wings based on their interaction
lengths in the calorimeter which differ by almost a factor of 2.
= 2 TeV were generated. In Fig. 6 we compare the distributions of antineutrons
and K°'s with E>10 GeV at a detector placed
60 m away from the IP. Note that except in the wings of the distribution
the antineutrons dominate. It may be possible to make a statistical separation
of antineutrons and K°'s on the wings based on their interaction
lengths in the calorimeter which differ by almost a factor of 2.
In the neutral beam setup, the magnetic field near the IP will sweep most charged particles <1 TeV into the iron of the bending magnets and quadrupoles. Thus background
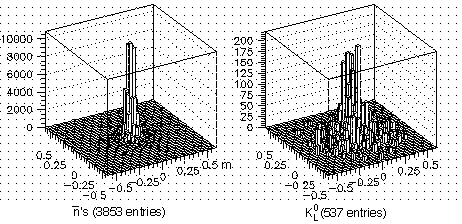
Figure 6--Antineutron and K0
spatial distributions at a detector 60 m from the IP. The region shown
is about 1 m square at the proposed detector in Fig. 2. An energy >10 GeV
is assumed. Magnet apertures were not considered in this example.
from secondaries produced between the IP and detector is not expected to be a problem. To verify this, we have performed a Monte Carlo simulation of the basic geometry. Rather than try to simulate the complicated magnetic fields in the iron of the magnets, we have taken the field in the iron to be zero. Thus the simulation may be somewhat pessimistic. The simplified geometry of the magnetic channel and detector used in this simulation of neutrals is described in Appendix I.
In the simulations discussed below, we use 200,000 PYTHIA "all QCD" events. In Figure 7 we compare the energy spectrum of g's in the detector that come directly from the collision ("primaries") to those that come from secondary interactions or decays. A minimum energy cut of 20 GeV is imposed. As expected, the primaries have a much harder spectrum. and they are ten times as numerous overall.
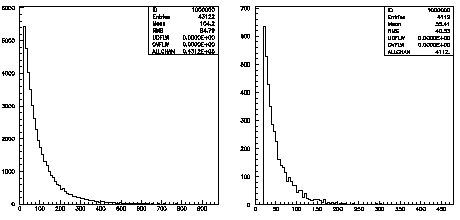
Primary g Energy
(GeV) Secondary g
Energy (GeV)
Figure 7--Primary and secondary g energy distributions at the detector. An energy >20 GeV is assumed.
The p°
spectrum can be determined from the two-photon events in the detector.
From the same 200K sample used for the g
spectrum above, we reconstruct the 2g
mass for events with two g's
in the detector and no hadrons. The minimum g
energy is taken to be 30 GeV. We assume a nominal
energy resolution of 0.15 for each g
and a resolution in their separation at the detector
of 2 cm, both with a Gaussian distribution. The reconstructed 2g
mass is shown in Fig. 8 for 2g
events from primary p°'s
and for all events with 2g's.
There are 9313 and 9218 entries below 0.7 GeV mass in the All and
Primary plots for the 200000 generated events. The h
peak near 0.55 GeV can be enhanced by suitable cuts on the opening angle
and energies of the g's.
for each g
and a resolution in their separation at the detector
of 2 cm, both with a Gaussian distribution. The reconstructed 2g
mass is shown in Fig. 8 for 2g
events from primary p°'s
and for all events with 2g's.
There are 9313 and 9218 entries below 0.7 GeV mass in the All and
Primary plots for the 200000 generated events. The h
peak near 0.55 GeV can be enhanced by suitable cuts on the opening angle
and energies of the g's.
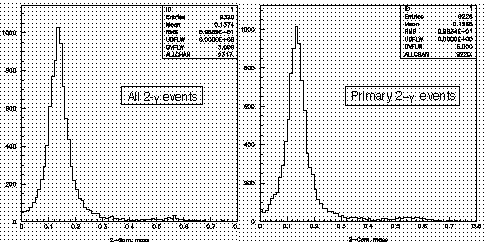
Figure 8--Reconstructed 2g
masses for all events with only 2g's
and for 2g events
coming directly from the  -p collision. An
energy resolution of 0.15
-p collision. An
energy resolution of 0.15 for each g
and a resolution in their separation at the detector
of 2 cm is assumed.
for each g
and a resolution in their separation at the detector
of 2 cm is assumed.
Antilambdas which decay in the space between
the IP and the detector can be reconstructed by looking at events with
high-energy charged hadron pairs in the detector. Using the same 200K sample
described above, we reconstruct the mass of all events with 2 and only
2 charged hadrons with energy >20 GeV in the calorimeter with the assumption
they are from  decays. The higher energy particle
is assumed to be the antiproton. A nominal smearing of 0.60
decays. The higher energy particle
is assumed to be the antiproton. A nominal smearing of 0.60 in the hadron energies and 1 mrad in their angles is assumed, again with
a Gaussian distribution. The resulting mass plots are shown in Fig. 9 for
all 2-hadron events and for primary
in the hadron energies and 1 mrad in their angles is assumed, again with
a Gaussian distribution. The resulting mass plots are shown in Fig. 9 for
all 2-hadron events and for primary  coming directly
from the collision. From the 200K sample we find 1693
coming directly
from the collision. From the 200K sample we find 1693  from all sources and 1624 primary
  in the reconstructed
mass range 1.00-1.30 GeV.
in the reconstructed
mass range 1.00-1.30 GeV.
The  spectrum can also
be reconstructed with reasonable accuracy by looking at the charged hadron
pairs. Using the same 200K PYTHIA sample, we reconstruct the mass of all
events with 2 and only 2 charged hadrons with energy >20 GeV in the calorimeter
with the assumption they are from
spectrum can also
be reconstructed with reasonable accuracy by looking at the charged hadron
pairs. Using the same 200K PYTHIA sample, we reconstruct the mass of all
events with 2 and only 2 charged hadrons with energy >20 GeV in the calorimeter
with the assumption they are from  decays. Both
charged particles are assumed to be pions. Again a nominal smearing of
0.60
decays. Both
charged particles are assumed to be pions. Again a nominal smearing of
0.60 in the hadron energies and 1 mrad in their
angles with a Gaussian distribution is assumed. The resulting mass plots
are shown in Fig. 10. From the 200K sample we find 276
in the hadron energies and 1 mrad in their
angles with a Gaussian distribution is assumed. The resulting mass plots
are shown in Fig. 10. From the 200K sample we find 276  from all sources and 232 primary
  in the reconstructed
mass range 0.30 to 0.70 GeV. The
in the reconstructed
mass range 0.30 to 0.70 GeV. The  energies range
from about 100 GeV to 800 GeV with a mean of 260 GeV.
energies range
from about 100 GeV to 800 GeV with a mean of 260 GeV.
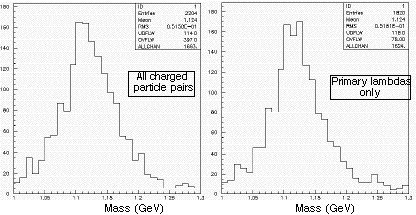
Fig. 9 - Reconstructed  masses for all 2-charged
hadron events and for only events with the two hadrons coming directly
from the
masses for all 2-charged
hadron events and for only events with the two hadrons coming directly
from the  collision. An energy resolution of 0.60
 for each hadron and
a resolution of 1.0 mrad in their angles is assumed.
for each hadron and
a resolution of 1.0 mrad in their angles is assumed.
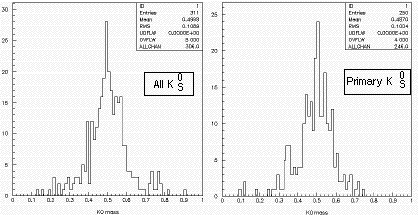
Figure 10--Reconstructed K0
masses for all 2-charged
hadron events and for only events with the two hadrons coming directly
from the  -p collision. An energy resolution
of 0.60
-p collision. An energy resolution
of 0.60 for each hadron
and a resolution of 1.0 mrad in their angles
is assumed.
for each hadron
and a resolution of 1.0 mrad in their angles
is assumed.
In general, we conclude that the background from interactions in the magnet elements will be small for all these processes. Much of the background is associated with interactions of diffractively scattered antiprotons near the exit of the magnet. (See Appendix I.) In the actual setup these will be accompanied by spectacular showers in the inner tracking chambers, so that it should be easy to identify many of the background events from this source.
The charged particle production measurements
are generally more straightforward. Without particle identification the
cross section will be for a mixture of hadrons of appropriate charge. For
the higher momenta the negative yields will be dominated by  's.
's.
F. Rates
The estimated luminosity with collisions taking place near the end of the C0 straight section is14 2 x 1028 cm-2 sec-1. The total interaction rate is therefore ~1500 Hz. Since the detectors accept a significant fraction of the interactions, a raw trigger rate of order 600 Hz can be anticipated. The actual trigger rate can easily be adjusted by prescaling triggers that correspond to lower energies in the calorimeter.
Because this is an experiment designed to explore
new territory and the basic cross sections are large, it is possible to
measure many of the cross section in a few minutes. For example, it would
require about 2 min. to obtain the equivalent of the 200K sample discussed
above, much less than the time required to generate the Monte Carlo events!
As another example, Centauro-like events are observed in ~1% of cosmic
ray interactions above  = 1 TeV, so these might
appear at ~1 Hz. The basic measurements can therefore be done with a few
days of dedicated running time. Tuning can be done with beam-gas interactions
and would require no dedicated beam time. At least three detector configurations
would be used, so it is convenient to have the dedicated running in at
least 3 time segments with sufficient access time in between to reconfigure.
The total dedicated Collider running is anticipated to be approx. 1 week.
= 1 TeV, so these might
appear at ~1 Hz. The basic measurements can therefore be done with a few
days of dedicated running time. Tuning can be done with beam-gas interactions
and would require no dedicated beam time. At least three detector configurations
would be used, so it is convenient to have the dedicated running in at
least 3 time segments with sufficient access time in between to reconfigure.
The total dedicated Collider running is anticipated to be approx. 1 week.
It is difficult to make realistic rate estimates
for rarer processes since production data at large rapidities and  = 2 TeV generally do not exist. A J/y
production measurement serves as a convenient
measure of the range of cross sections that are achievable and production
data at y = 0 are available, so we use it as an example. The CDF collaboration
has measured y and
y' production for
pseudorapidity -0.6 > h
> 0.6,
= 2 TeV generally do not exist. A J/y
production measurement serves as a convenient
measure of the range of cross sections that are achievable and production
data at y = 0 are available, so we use it as an example. The CDF collaboration
has measured y and
y' production for
pseudorapidity -0.6 > h
> 0.6,  = 1.8 TeV, and pT
down to about 5 GeV/c.15 We need to extrapolate this
to pT ~ 0 and rapidities y in the range 3.0-4.6 appropriate
for this experiment. Since pT = 0 for the proposed
measurement, perturbative QCD calculations are not reliable. D0 has measured
y production15
at pT >8 GeV/c and pseudorapidities from 0
to 3.2. They find the rapidity dependence is fairly flat. At pT
= 5 GeV/c, the smallest pT measured by CDF, the pT
dependence is steeply rising with a cross section for total y
production of
= 1.8 TeV, and pT
down to about 5 GeV/c.15 We need to extrapolate this
to pT ~ 0 and rapidities y in the range 3.0-4.6 appropriate
for this experiment. Since pT = 0 for the proposed
measurement, perturbative QCD calculations are not reliable. D0 has measured
y production15
at pT >8 GeV/c and pseudorapidities from 0
to 3.2. They find the rapidity dependence is fairly flat. At pT
= 5 GeV/c, the smallest pT measured by CDF, the pT
dependence is steeply rising with a cross section for total y
production of  10 nb/GeV.
For the purpose of estimating the event rate for y's,
we assume the cross section rises a factor of 20 between pT
= 5 and pT = 1 GeV/c and we assume approx. the same
cross section for rapidities 3-4.6 at small pT. A
PYTHIA/GEANT simulation of the detector configuration in Fig. 4 shows that
approximately 3.5% of all yÆ2m
events are accepted by the detector. Assuming a luminosity =2 x
1028 cm-2
sec-1, we get a detection rate for y
Æ 2m or y Æ
2e of
about 2.0 events per hour. Thus a y measurement
appears to be feasible, as is the Drell-Yan continuum near the y.
For y', the (cross
section x branching ratio) is only a factor of
2 smaller at the same pT so this also appears to
be practical.
10 nb/GeV.
For the purpose of estimating the event rate for y's,
we assume the cross section rises a factor of 20 between pT
= 5 and pT = 1 GeV/c and we assume approx. the same
cross section for rapidities 3-4.6 at small pT. A
PYTHIA/GEANT simulation of the detector configuration in Fig. 4 shows that
approximately 3.5% of all yÆ2m
events are accepted by the detector. Assuming a luminosity =2 x
1028 cm-2
sec-1, we get a detection rate for y
Æ 2m or y Æ
2e of
about 2.0 events per hour. Thus a y measurement
appears to be feasible, as is the Drell-Yan continuum near the y.
For y', the (cross
section x branching ratio) is only a factor of
2 smaller at the same pT so this also appears to
be practical.
G. Beam-Gas Interactions
For interaction points within the cold magnets the beam-gas rates are expected to be low because of the extremely good vacuum there. In the cold pipe the pressure is <<10-11 torr.16 In the warm straight sections it is typically <10-9 torr. In the cold sections most of the gas is hydrogen; in the warm sections it is a mixture of hydrogen and CO.
The trigger counter requirement (Figure 2) limits
the length of the region from which triggers can come to ~20 m in length.
Triggers from the circulating protons will generally be out of time with
respect to the bunch collisions and so can be rejected by timing. Thus
we estimate the trigger rate from a 20 m section of cold vacuum from  's
alone. With a pressure <10-11 torr,
the probability of a
's
alone. With a pressure <10-11 torr,
the probability of a  interacting in a 20 m section
is <6 x 10-17.
interacting in a 20 m section
is <6 x 10-17.
For the luminosity of 2 x
1028 cm-2 sec-1
we assume, there are ~2.4 x 10¹¹
circulating  's. The beam-gas interaction
rate is therefore <6 x 10-17
x 2.4 x 1011
x 4.8 x 104
turns/s-1 = 0.7 Hz. From a PYTHIA simulation, about
50% of these will give a neutral particle with energy >20 GeV in the detector.
This gives a trigger rate from beam-gas interactions <0.4 Hz, compared
to a rate ~500 Hz from beam-beam interactions. Beam-gas triggers can be
studied at leisure without requiring collisions near C0 and corrections
to the collider data can be made as necessary. Most can be removed in the
analysis because the tracking of accompanying charged particles will allow
the position of the interaction to be determined to <<10 m accuracy.
's. The beam-gas interaction
rate is therefore <6 x 10-17
x 2.4 x 1011
x 4.8 x 104
turns/s-1 = 0.7 Hz. From a PYTHIA simulation, about
50% of these will give a neutral particle with energy >20 GeV in the detector.
This gives a trigger rate from beam-gas interactions <0.4 Hz, compared
to a rate ~500 Hz from beam-beam interactions. Beam-gas triggers can be
studied at leisure without requiring collisions near C0 and corrections
to the collider data can be made as necessary. Most can be removed in the
analysis because the tracking of accompanying charged particles will allow
the position of the interaction to be determined to <<10 m accuracy.
For high-momentum positive particles (Fig. 3a)
and for negative (Fig. 3b), the beam-gas contribution should be lower because
the position of their origin can be determined to <20 m accuracy from
the tracking information. For lower momentum negatives and positives, the
IP is in the warm vacuum (Fig. 4), but the length of the source region
will be ~1 m, so again the beam-gas rates will be low compared to beam-beam.
H. Impact Statement
Basic needs for the experiment are relatively
modest. In the setups shown in Figs. 2-4 and in the discussions, we assumed
the detectors are located in the forward  direction.
This has an advantage of somewhat reduced beam-gas background, but there
is no reason why the measurement could not be made just as well in the
forward p direction. In general we have considerable flexibility
in the design, and the above should only be considered scenarios.
direction.
This has an advantage of somewhat reduced beam-gas background, but there
is no reason why the measurement could not be made just as well in the
forward p direction. In general we have considerable flexibility
in the design, and the above should only be considered scenarios.
In principle the experiment could be set up at any long straight section. However, because of the new collision hall planned for C0, it is the logical choice. The possibility of clearing out material near the beam exists at C0, and the infrastructure necessary to support the experiment will be available there. If the experiment is installed at C0, it is assumed that the C-magnets and Lambertsons now located there would be removed or relocated. Most of this work would be required for the BTeV detector expected to be installed there in any case. Our main requirement is a clear path for the particles. We also need a "thin" window such as that shown in Figs. 2-4; this can be =2 mm thick since the particles are incident near 90°.
In Figure 2 we assumed the existing C-magnets are moved closer to the cold quadrupole labeled Q1. It is also assumed that the vacuum pipe through at least one of the C-magnets is enlarged to fill the maximum aperture available. We assume the Lambertsons are removed, but these could be accommodated with difficulty. Additional bending power is needed in the lattice on the other side of the straight section to compensate for the removal of the Lambertsons. This can be provided by replacing a cold half-dipole with a full dipole, as proposed for the BTeV detector. An additional small dipole corrector magnet, comparable to half a C-magnet, will probably also be necessary to close the lattice. Other scenarios such as replacing the C-magnets or Lambertsons with switchyard magnets are also possible and are being investigated.
This experiment is unlikely to be compatible with the complete BTeV detector to be proposed for the C0 area. This suggests that it should be staged in Run 2 while the upgraded CDF and D0 detectors are being recommissioned and before the installation of the complete BTeV detector. Compatibility with BTeV testing should not be a problem. Installation could begin as soon as the hall is available for beneficial occupancy.
The detector could be tuned with beam-gas interactions. Total dedicated running time is estimated to be one week. At least 3 configurations of the detector would be required for the charged and neutral measurements. Reconfiguring would require access for periods of a day or so.
A "straw man" calorimeter is outlined in Appendix II. Total channel count for the calorimeter ADCs would be ~100. Tracking chambers and the luminosity monitor would entail ~5000 channels. Trigger rates will be <600 Hz. PREP and computer needs would be commensurate with these parameters.
To study 2-muon production, the calorimeters
would need to be backed by muon detectors. These could be the pair of muon
detectors built for E871 by the Michigan group.
I. Conclusions
The lack of any data on hadron production at very forward angles for collider energies is an embarrassing deficiency. With a modest commitment of resources and running time we can do a comprehensive measurement of the spectrum of neutral and charged particles at very forward angles from the Collider. This would be the first measurement of 0° production at collider energies. These data are critical to understanding the origin of cosmic rays with energies > 1 PeV. The physics addressed by this measurement is both compelling and of great general interest. This is an experiment that cries out to be done.
The construction of the new experimental area
at C0 provides a unique opportunity to make this very important measurement.
Since the cross sections to be studied are large and tuneup and beam-gas
background studies can be done without colliding beams, the total dedicated
running time required for the measurements is < 1 week. Monte Carlo
studies show that the p0,  ,
,  ,
and antineutron signals can be extracted from the neutral data with reasonable
detector parameters.
,
and antineutron signals can be extracted from the neutral data with reasonable
detector parameters.
While we use PYTHIA minimum bias events for planning
purposes, these are based on a long extrapolation from much lower energy
data. The reality may be quite different.
1. Beam Fragmentation, Energy Flow and Inelasticity Estimates in Minimum Bias Accelerator Experiments, L. Voyvodic,Very High Energy Cosmic-Ray Interactions 1992, AIP Conf. Proc. 276, p. 231.
2. Inclusive Production of p0's
and Feynman Scaling Test in the Fragmentation Region at the  Collider, E. Pare, T. Doke, M. Haguenauer, V. Innocente, K. Kasahara, T.
Kashiwagi, J. Kikuchi, S. Lanzano, K. Masuda, H. Murakami, Y. Muraki, T.
Nakada, A. Nakamoto, and T. Yuda, Phys. Lett. B242, 531 (1990).
Collider, E. Pare, T. Doke, M. Haguenauer, V. Innocente, K. Kasahara, T.
Kashiwagi, J. Kikuchi, S. Lanzano, K. Masuda, H. Murakami, Y. Muraki, T.
Nakada, A. Nakamoto, and T. Yuda, Phys. Lett. B242, 531 (1990).
3. Extrapolation of Hadronic Physics to Air Shower Energies, T. K. Gaisser, Very High Energy Cosmic-Ray Interactions 1992, AIP Conf. Proc. 276, p. 397.
4. Pierre Auger Observatory Design Report, Auger Collaboration, Revised Mar. 14, 1997.
The Search for the Source of the Highest-Energy Cosmic Rays, F. Halzen, MADPH-97-990. Presented at International Workshop on New Worlds in Astroparticle Physics, Faro, Portugal, Sep. 1996. E-Print Archive: astro-ph/9704020.
5. "Every time a new window is opened, we find a new surprise.", John Peoples at Fermilab Users Meeting, July 14, 1997.
6. A Full Acceptance SSC Detector: The Cosmic-Ray Connection, F. Halzen, Very High Energy Cosmic-Ray Interactions 1992, AIP Conf. Proc . 276, p. 679.
7. S. A. Slavatinsky, Proc. VIII International Symposium on Very High Energy Cosmic-Ray Interactions, Tokyo 1994, p. 31.
8. C. M. Lattes, Y. Fujimoto, and S. Hasegawa, Phys. Reports 65 (1980).
9. H. Wilczynski (for the JACEE Collaboration), Nucl. Phys. B (Proc. Suppl.) 52B, 81 (1997).
10 A Search for Disoriented Chiral Condensate at
Fermilab, by MiniMax Collaboration (J.D. Bjorken for the collaboration),
SLAC-PUB-7343, Oct.1996. Contributed to 26th International Symposium on
Multiparticle Dynamics, Faro, Portugal, Sept. 1996.
Preliminary Results from a Search for Disoriented Chiral Condensates at MiniMax, by MiniMax Collaboration (J. Streets for the collaboration). To be published in the proceedings of 1996 Annual Divisional Meeting (DPF 96).
Early Results from MiniMax, a Disoriented Chiral Condensate Search at the Tevatron,
C. C. Taylor for the MiniMax Collaboration, RHIC Summer Study Proceedings, July 1996.
11. Search for Centauro Events at CDF, P.L. Melese (CDF Collaboration), FERMILAB-Conf-96/205-E, July 1996 Submitted to the XIth Topical Workshop on p-pbar Collider Physics, Abano Terme, Italy, June 1996.
12. FELIX: A Full Acceptance Detector for the LHC, FELIX Collaboration, CERN/LHCC 97-45, 1 August 1997.
13. PYTHIA 5.7 and JETSET 7.4 Physics and Manual, T. Sjöstrand, Computer Physics Commun. 82, 74 (1994).
14. M. Martens, private communication. This luminosity estimate is based on experience with MiniMax at C0. It assumes collisions with 6 x 6 bunches, rather than the 36 x 36 expected for normal running in Run II. The luminosity with 36 x 36 bunches would be about half as large.
15. Quarkonia Production at CDF and D0, V. Papadimitriou (Texas Tech). FERMILAB-CONF-96-135-E, Mar 1996. Presented at 31st Rencontres de Moriond: QCD and High-energy Hadronic Interactions, Les Arcs, March 1996.
16. G. Jackson, Fermilab, private communication.
The actual geometry of the magnetic channel may differ significantly from that shown in Figs. 2-4. It is also difficult to model the complicated magnetic fields in the iron of the magnets to estimate the background in the detector due to secondary particles that are generated when primary hadrons and g's interact in the iron. There are also significant uncertainties in the physics built into the PYTHIA/JETSET simulation.
For the purpose of estimating these backgrounds we use a simplified geometry which retains the important features of the 0° neutral geometry of Fig. 2. The magnet string between the interaction point and the detector is approximated by a cylindrical iron tube.
Rather than try to simulate the complicated magnetic field in the iron, the field there is taken to be zero. The field in the bore of the tube is taken to be a uniform 3 T. The length of the tube is taken to be 10 m which gives an integrated magnetic field comparable to that between the IP and detector in Fig. 2. The inner diameter of the tube is taken as 7 cm which is approximately the bore of a Tevatron dipole/quadrupole(6.2/8.1 cm). This gives a detector acceptance that is smaller than the acceptance for the geometry in Fig. 2 horizontally but larger vertically than that determined by the 3 cm C-magnet aperture. The geometry for the simulation is illustrated in Fig. I-1. The region between the tube exit and the detector is assumed to be filled with helium gas.
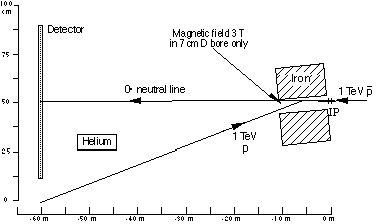
Figure I-1--The geometry used in the simulation. Antiprotons are incident from the right as in Figs. 2-4. The Tevatron magnets between the IP and the detector are simulated by a magnetic field of 3 T in a cylindrical 7 cm diameter bore. The surrounding iron is taken to have no magnetic field.
The events were generated with PYTHIA with all QCD processes turned on and a center-of-mass energy of 2 TeV. This gave a total generated cross section of 74.2 mb, including 15.1 mb of elastic scattering and 19.5 mb of single and double diffraction. Events with hits in the detector were saved in an ntuple for further analysis. Particles with momenta < 2 GeV/c were disregarded.
Fig. I-2 shows examples of generated events from
the 0° neutral simulation. In Fig. I-2(a) we see the most common type,
a diffractively produced  . In Fig. I-2(b) we see
a 2g event. Figure
I-2(d) shows an event in which a
. In Fig. I-2(b) we see
a 2g event. Figure
I-2(d) shows an event in which a  scatters diffractively
and strikes near the exit of the tube. This is a significant source of
background in the detector as discussed in Sect. D. Note that the
scatters diffractively
and strikes near the exit of the tube. This is a significant source of
background in the detector as discussed in Sect. D. Note that the  produces a spectacular shower in the luminosity monitor, which makes it
possible to recognize such events.
produces a spectacular shower in the luminosity monitor, which makes it
possible to recognize such events.
A more detailed simulation is being developed.
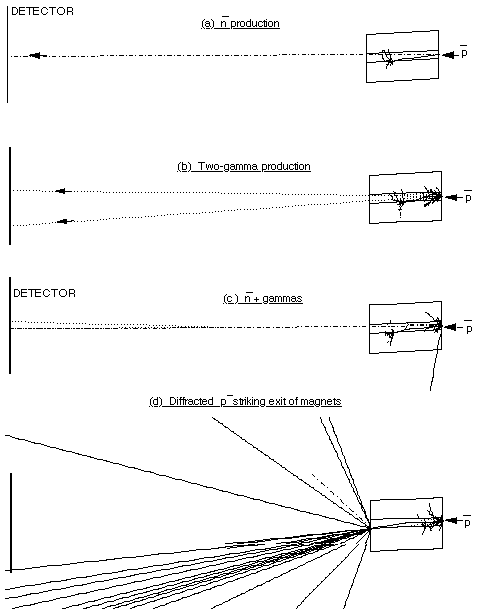
Figure II-2-- Examples of events from PYTHIA/GEANT simulation. The antiprotons are incident from the right.
A possible design for the calorimeter(s) is shown in Fig. II-1a. The calorimeter is a lead-scintillator sandwich with readout by wavelength shifter bars and photomultiplier tubes. The upstream part of the calorimeter serves as the electromagnetic section and is more finely segmented. In the front section the lead plates are 1 cm thick. In the later sections the lead is 1.5 cm thick. Each lead plate is followed by a 0.5 cm thick scintillator for a total of 114 lead plates and 114 scintillators. Light from either side of the scintillators is collected in wavelength shifter bars, each coupled to individual photomultipliers. This gives a total of 8 samplings in depth. The total calorimeter as shown is approx. 10.4 interaction lengths deep. The lead/scintillator ratio is such that the calorimeter has a p/e =1.
For localizing the showers, proportional chambers with tubes 1 cm x 0.6 cm in cross section are interspersed through the calorimeter (Fig. II b). These are paired with an x plane and a y plane and have pulse-height readout.
We estimate <100 ADC channels will be required
for the calorimetry. The proportional tubes in the calorimeter will be
read out using a Michigan-designed system. The wire chambers in the tracking
chambers ahead of the calorimeter and in the luminosity monitor would entail
~5000 channels.
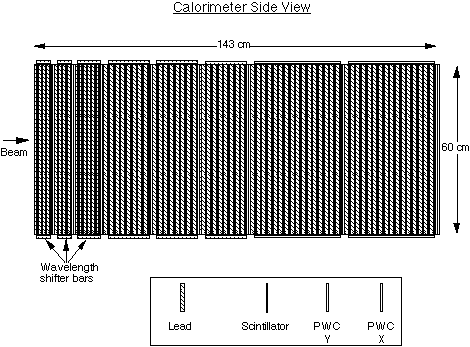
Figure II-1(a)--Possible calorimeter design
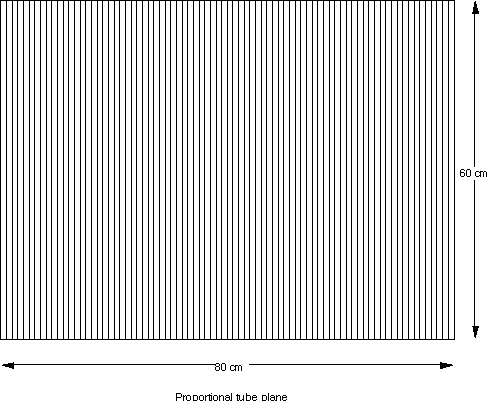
Figure II-1(b)--Proportional tube plane with vertical wires